
Short answer
Temperature mapping is a study that places calibrated data loggers (±0.5 °C or better) on a grid throughout a refrigerator, cold room or warehouse, typically every 5–10 m at three heights, and records every 1–5 minutes for 24 hours to 7 days or more. It identifies hot and cold spots, proves the space stays within range, such as 2–8 °C, and shows where monitoring probes belong.
Key takeaways
- EU GDP 2013/C 343/01 requires an initial temperature mapping of storage areas before use and repeat mapping after significant changes or as a risk assessment requires.
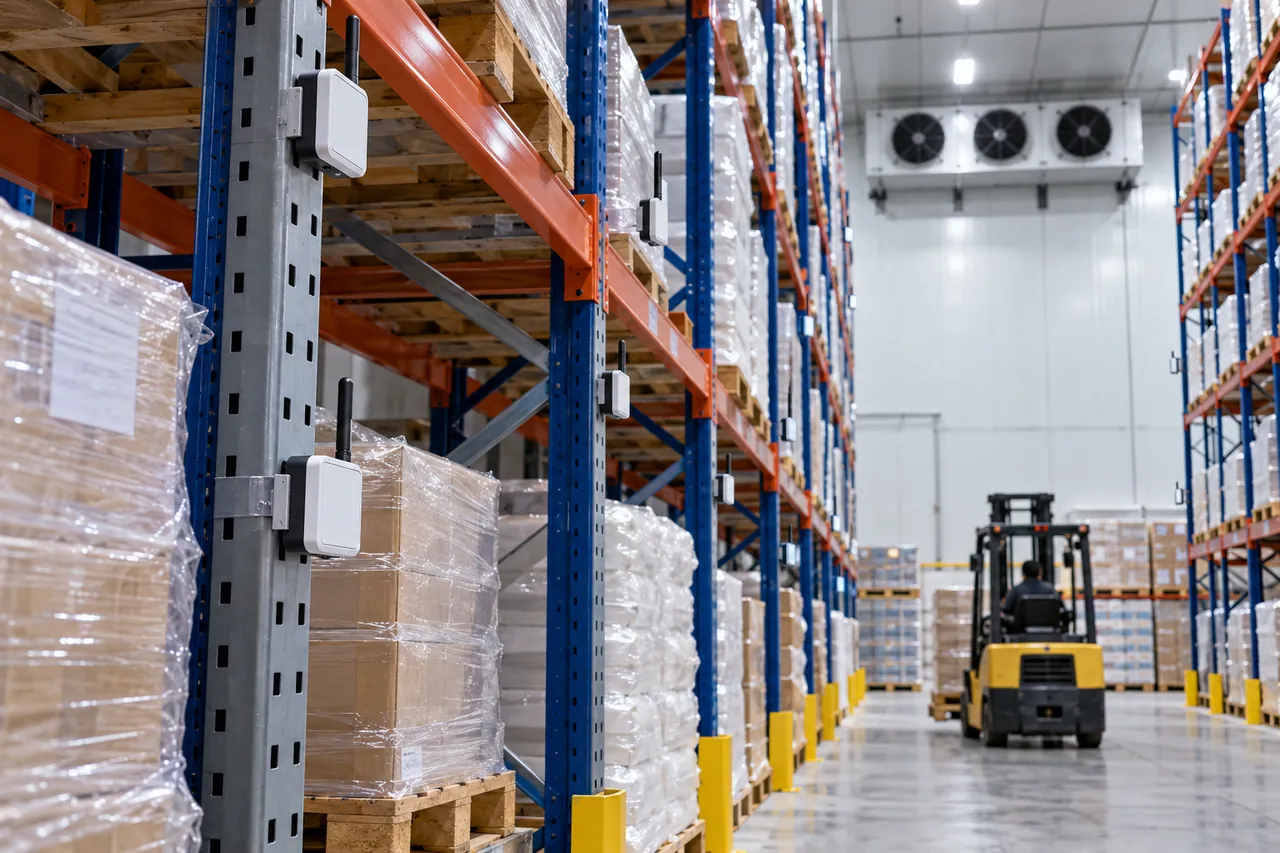
- Warehouse mapping grids typically place loggers every 5–10 m (16–33 ft) at three heights, plus extra points at doors, evaporators and under the roof.
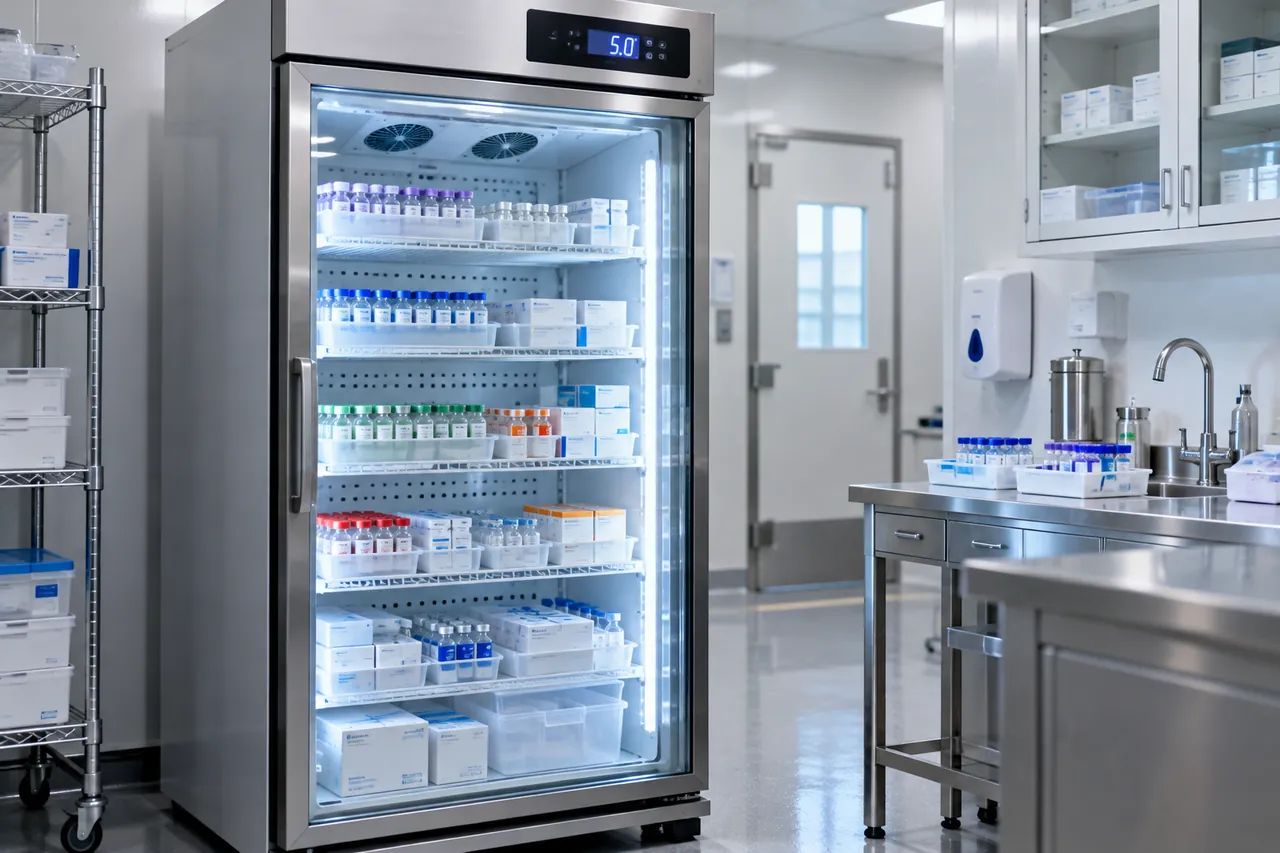
- A refrigerator mapping study typically uses 9 loggers (8 corners and the centre) plus 1 ambient logger for 24–72 hours.
- Mapping loggers should be accurate to ±0.5 °C (±0.9 °F) or better, calibrated at 2–3 points across the range, logging every 1–5 minutes.
- Ambient pharmaceutical warehouses at 15–25 °C (59–77 °F) should be mapped for 7 days or more in both summer and winter.
- Most mapping failures come from door infiltration, poor evaporator air throw, uninsulated roofs or product stored in the coil discharge.
What is temperature mapping?
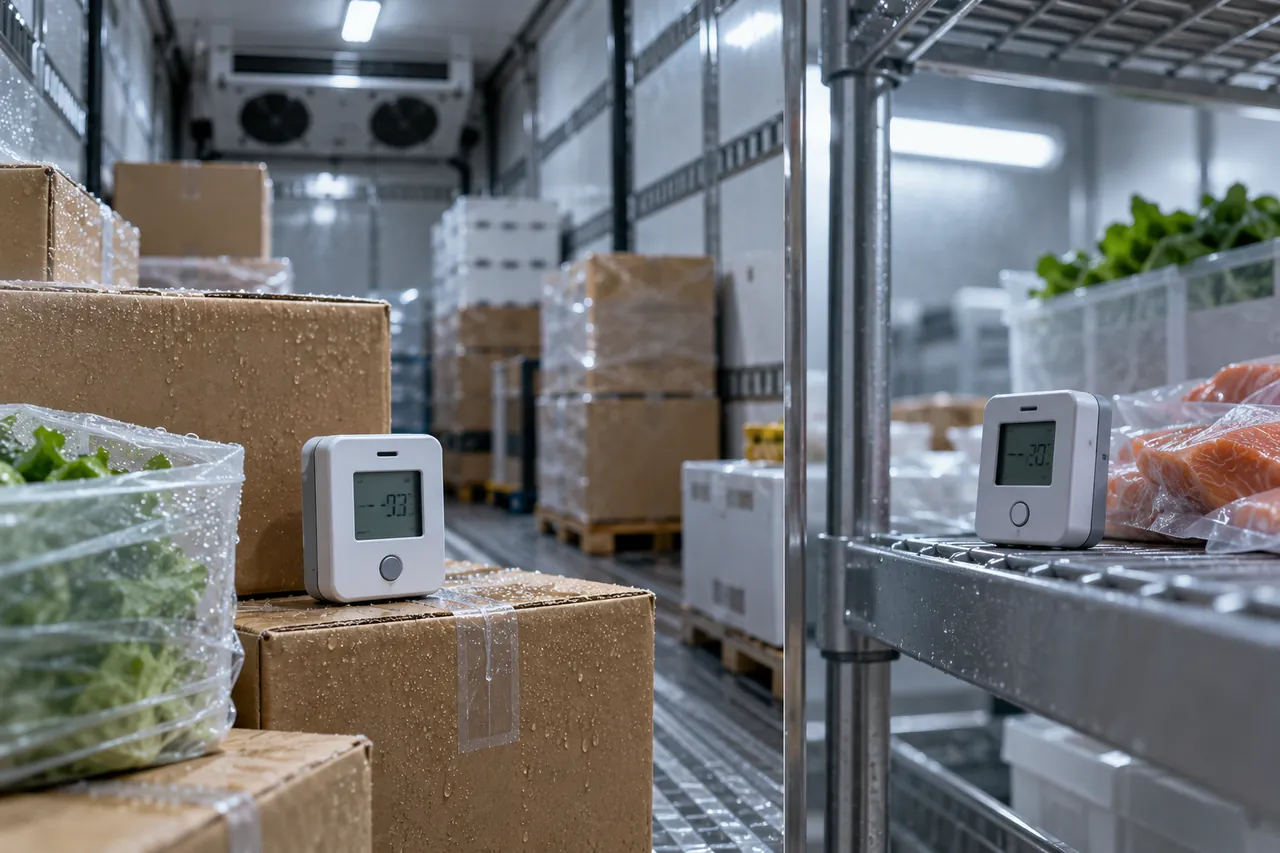
Temperature mapping is a documented study that places calibrated data loggers throughout a storage space for a set period to measure how temperature varies from point to point and over time. The result shows where the hot and cold spots are, whether every location stays inside the required range, and where permanent monitoring probes should go.
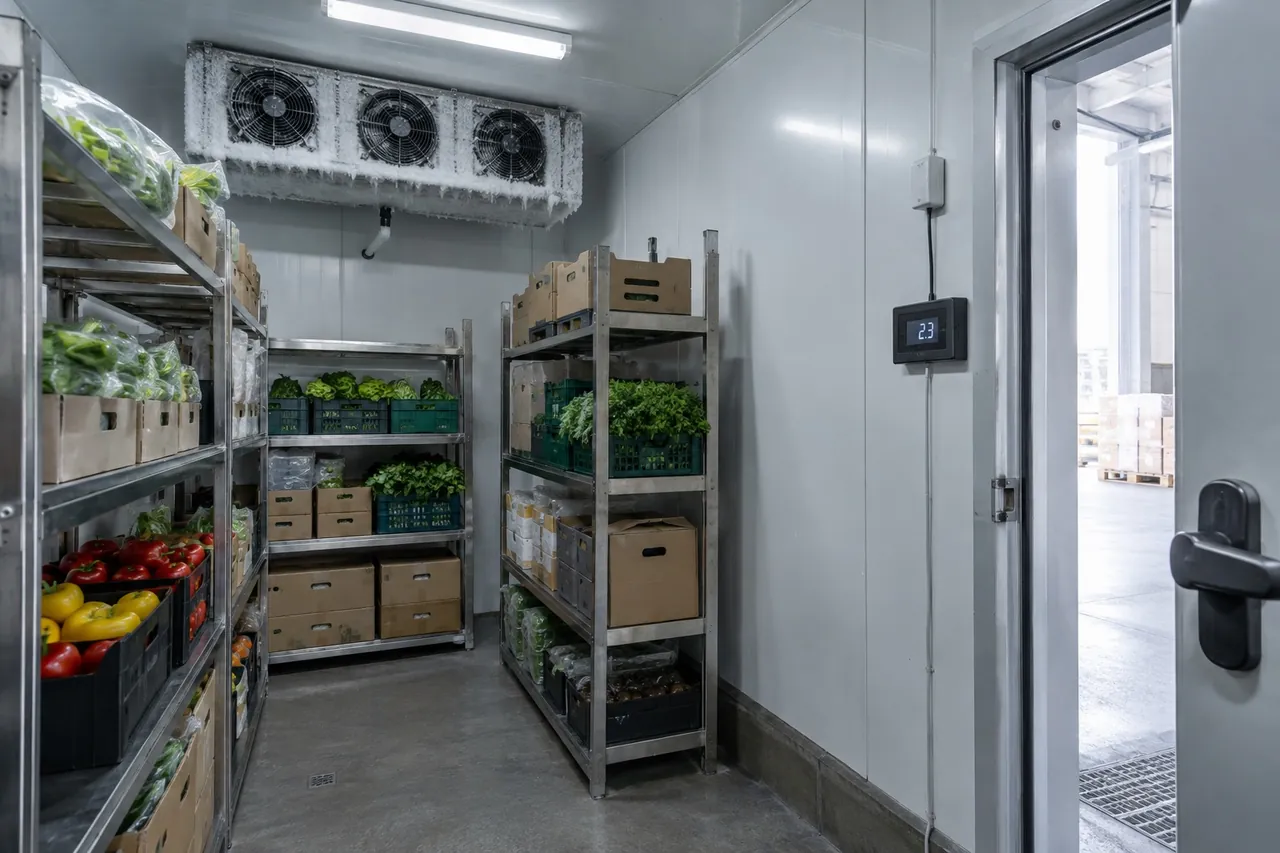
A cold room, refrigerator or warehouse never holds one temperature. Air leaving an evaporator may be 4–6 K colder than air returning to it, warm air pours in at the door, racking blocks airflow, and roof panels heat up on a summer afternoon. A controller display shows the temperature at one sensor only. Warehouse temperature mapping answers the question the display cannot: is the product on the top shelf at the back of rack 12 also within 2–8 °C (36–46 °F), or 15–25 °C (59–77 °F)?
Mapping is required for pharmaceutical storage under Good Distribution Practice and is increasingly expected by food retailers, auditors and insurers for chilled and frozen food stores. It is also the fastest way to find out why one corner of a new walk-in keeps alarming.
Temperature mapping vs warehouse temperature monitoring
Temperature mapping is a one-off or periodic study with many loggers; warehouse temperature monitoring is the continuous, permanent measurement of a few fixed sensors, with alarms. Mapping tells you where to put the monitoring sensors and proves the space is fit for use; monitoring proves it stays that way every day.
| Item | Temperature mapping study | Continuous monitoring system |
|---|---|---|
| Purpose | Characterise the space, find hot and cold spots, qualify the room | Record and alarm on routine conditions |
| Number of sensors | 9–15 for a refrigerator or small walk-in; 20–100+ for a warehouse | 1–2 per small room; one per zone or per hot/cold spot in a warehouse |
| Duration | 24–72 hours (small units) to 7 days or more; repeated summer and winter for ambient stores | Permanent, 24/7 |
| Logging interval | 1–5 minutes | 5–15 minutes |
| Output | Mapping report with min/max/mean per point, heat maps, recommendations | Daily records, alarm log, audit trail |
| Typical trigger | New room, major change, periodic requalification | Always running |
The two work together. A warehouse temperature monitoring system placed without a mapping study often watches the most stable spot in the room, close to the evaporator return, while product on a high shelf near the door drifts out of range unnoticed. For how to choose sensors, logging intervals and alarm delays for the permanent system, see our cold room temperature monitoring guide.
Which temperature mapping guidelines apply?
For medicines, the main temperature mapping guidelines are the EU Guidelines on Good Distribution Practice (2013/C 343/01), the WHO technical supplement on temperature mapping of storage areas (published with WHO Technical Report Series No. 961, Annex 9) and USP general chapter <1079> on good storage and distribution practices. For food, mapping is a tool used inside a HACCP plan rather than a separately named legal requirement.
- EU GDP 2013/C 343/01 requires an initial temperature mapping exercise of the storage area under representative conditions before use, with equipment for monitoring located according to the results, and repeat mapping based on a risk assessment or whenever significant modifications are made to the facility or the temperature-controlling equipment.
- WHO guidance describes how to write a mapping protocol, how to place loggers, how long to map, the need to map in hot and cold seasons for spaces affected by outside weather, and what the report should contain.
- USP <1079> and its supporting chapters cover qualification of storage areas and the use of mean kinetic temperature (MKT) when evaluating excursions.
- HACCP-based food safety schemes require cold storage to be controlled and verified at a critical limit, typically 5 °C (41 °F) or below for chilled food under the FDA Food Code and −18 °C (0 °F) or below for frozen food. A mapping study is the evidence that the critical limit holds everywhere in the room, not just at the controller.
Your national regulator or customer may add its own requirements, such as a minimum mapping duration or a specific logger accuracy, so read their guidance alongside the general rules above. Our pharmaceutical cold chain and vaccine storage guide covers the 2–8 °C storage rules that usually drive these studies.
What data loggers do you need for temperature mapping?
A data logger for temperature mapping should read to at least ±0.5 °C (±0.9 °F) accuracy with 0.1 °C resolution, carry a current calibration certificate traceable to national standards (ideally from an ISO/IEC 17025 accredited laboratory) at points that bracket the range being mapped, and log at 1–5 minute intervals for the whole study.
| Specification | Typical requirement for mapping | Why it matters |
|---|---|---|
| Accuracy | ±0.5 °C (±0.9 °F) or better; ±0.2–0.3 °C for tight 2–8 °C work | An error of ±1 °C can hide a real excursion near 8 °C |
| Calibration points | At least 2–3 points covering the range, e.g. −25, −18 and 0 °C for a freezer; 2, 8 and 25 °C for a pharma store | Proves accuracy where you actually measure |
| Logging interval | 1 minute for fridges and door tests; 2–5 minutes for rooms and warehouses | Catches short peaks after door openings and defrosts |
| Memory | Enough for the full study at the chosen interval, plus margin | A logger that stops on day 5 of 7 invalidates that point |
| Probe type | Internal sensor for air; external probe or buffered probe for product simulation | Buffered probes (glycol vial) mimic product rather than air |
| Data integrity | Time-synchronised, tamper-evident files, audit trail (21 CFR Part 11 / EU GMP Annex 11 where applicable) | Regulators reject data that could have been edited |
Most mapping studies use self-contained USB or wireless loggers rather than the permanent monitoring system, because you need many more points for a short time. Wireless loggers save a trip into the room to download but must be checked for signal dropout behind metal racking. For a full comparison of logger types, accuracy classes and USB versus wireless units, see our temperature data logger guide. Before and after the study, check all loggers side by side in a stable environment; any logger that reads outside the group by more than its stated accuracy should be removed from the results.
Temperature mapping procedure: how to map a warehouse or cold room
A temperature mapping procedure for a warehouse follows a written protocol: define the space and acceptance range, place loggers on a three-dimensional grid plus at known risk points, record for a defined period under normal operation, run stress tests, then analyse and report. The steps below follow the structure used in WHO and GDP guidance.
- Write the protocol. State the scope (room or zone), the acceptance range (for example 2–8 °C, 15–25 °C or −18 °C or below), the logger layout drawing, the study duration, the logging interval, the tests to be run and who approves the report.
- Gather the room data. Collect drawings, rack layouts, the positions of evaporators, doors, windows, lights and heaters, the controller set point and differential, and the defrost schedule.
- Check the loggers. Confirm calibration certificates, set all clocks to the same time source, set the interval and start time, and label each logger with its location code.
- Place the loggers. Use the grid in the next section, plus extra loggers at the door, near the evaporator discharge and return, under the roof, near outside walls and at any known problem spot. Put one logger outside the room to record ambient conditions.
- Record under normal operation. Keep the room loaded as it normally is and working as normal, with routine door openings, deliveries and defrosts. Leave loggers untouched for the full period.
- Run stress tests. Record a door-open test (for example the door held open for a typical loading time), a power-failure or hold-over test to see how long the room stays in range with the refrigeration off, and the recovery time after the power returns.
- Retrieve and analyse. Download all loggers, check for gaps, and calculate minimum, maximum and mean temperature and time out of range for every location. Identify the warmest and coldest points.
- Report and act. State whether the space meets the acceptance criteria, mark areas where product must not be stored, recommend permanent monitoring positions at the worst-case points, and list corrective actions.
Do not adjust the controller, move racks or change the defrost schedule during the study. If a change is needed, finish the study, make the change under change control and map again.
How many loggers, where, and for how long?
Use a grid with loggers at three heights (low, middle and top of the storage zone) and spaced about every 5–10 m (16–33 ft) along the length and width of a warehouse, plus extra loggers at doors, evaporators and outside walls. A domestic-sized or reach-in pharmacy temperature mapping refrigerator study typically uses 9 loggers (8 corners plus centre) with one more outside.
| Space | Typical logger count | Typical duration | Notes |
|---|---|---|---|
| Refrigerator or freezer cabinet, up to about 1.5 m³ | 9 (corners and centre) + 1 ambient | 24–72 hours | Include door-open and power-off tests |
| Walk-in cold room, 10–60 m³ | 15–27 (corners and centre at 3 heights, plus door and evaporator) | 72 hours to 7 days | Map empty and loaded if possible |
| Cold store or chilled warehouse, 500–5,000 m² | 30–100+ on a 5–10 m grid at 3 heights | 7 days minimum, including a weekend | Add loggers at dock doors and under roof |
| Ambient (15–25 °C) pharma warehouse | Grid as above, more under roof and on south or west walls | 7 days or more, in summer and in winter | Seasonal mapping is the key requirement |
| Reefer container or vehicle body | 9–15 along the length at 3 heights | A full trip or 24–48 hours static | Include door openings for delivery routes |
Placement rules that catch the real risks
- Bottom loggers at about 0.3 m (12 in) off the floor, top loggers at the highest shelf where product is stored, not at the ceiling.
- Keep loggers off direct contact with walls, evaporator coils and lights, which would record surface temperature instead of air.
- Place extra loggers in the airflow from the evaporator and in dead zones behind full pallets.
- For freezers, add a logger near the door frame and at floor level where warm air infiltrates; for chillers, add one in the coil discharge where product can freeze.
How does temperature mapping fit into validation?
Temperature mapping validation is the part of qualifying a storage area that shows it performs as intended. Mapping data typically forms the operational qualification (OQ, often empty or partly loaded) and performance qualification (PQ, under normal loaded use) after an installation qualification (IQ) has confirmed the room and equipment were built and installed as specified.
- IQ (installation qualification): panels, door, refrigeration unit, controller, sensors and alarms installed as per design; calibration certificates and manuals on file.
- OQ (operational qualification): controller holds set point, alarms work, defrost works, and an empty or lightly loaded mapping study passes.
- PQ (performance qualification): a loaded mapping study under real operation, including door openings and seasonal extremes, passes the acceptance criteria.
Requalify after significant changes: moving or adding racking, replacing the evaporator or condensing unit, changing the controller or set point, extending the room, or after repeated excursions. Many companies also remap on a fixed cycle, typically every 2–3 years for stable rooms, as part of their risk assessment.
How to fix hot and cold spots: warehouse temperature control
Good warehouse temperature control starts with the building and refrigeration design, not with more sensors. Most mapping failures trace back to poor airflow, too little refrigeration capacity in peak conditions, heat entering through doors or roofs, or product stored too close to the evaporator.
| Mapping finding | Likely cause | Typical fix |
|---|---|---|
| Warm spots near the door | Infiltration during loading; no strip curtain or air curtain | Strip curtain, faster doors, a vestibule or ante-room, shorter door-open times |
| Warm spots under the roof or at top shelves | Thin or uninsulated roof, heat stratification | Insulated roof panels, destratification fans, lower top shelf limit |
| Cold spots or frozen product in a chiller | Product in evaporator discharge air | Keep product 0.5 m clear of the coil, add air diffusers or deflectors |
| Large swings at every point | Wide controller differential, undersized unit, long defrosts | Narrow the differential, check capacity, shorten or retime defrost |
| Dead zones behind pallets | Blocked airflow, pallets against walls | Leave 100–150 mm (4–6 in) wall gaps and air paths between pallets |
| Fails only in summer | Condensing unit losing capacity in high ambient temperatures | Shade and ventilate the condensing unit, resize for design ambient |
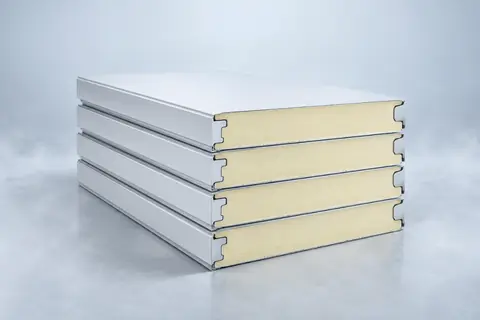
When a new room is being designed, a correctly sized refrigeration system with even air throw and adequate panel thickness makes mapping a formality rather than a fight. Use our cold room refrigeration load calculator to check capacity, and our guide to cold room panel thickness to choose wall and roof panels that limit heat gain. Humidity often needs mapping too in produce and pharmaceutical stores; see humidity in cold storage.
Checklist: planning a mapping study that passes
A mapping study passes when the room is right before the loggers go in. Use this checklist for new cold rooms and warehouses and for temperature mapping pharmaceutical warehouse projects:
- Acceptance range, study duration, logger layout and stress tests written in an approved protocol before you start.
- Calibrated loggers of ±0.5 °C or better, synchronised clocks, plus one ambient logger outside the space.
- Room commissioned and stable for at least 24 hours at set point before the study begins.
- Refrigeration sized for the hottest expected ambient and the real door-opening pattern, with a controller differential of about 1–2 K for tight ranges.
- Evaporator air throw that reaches the far end of the room, and racks set back from walls and coils.
- Door protection (strip curtain, self-closing door, or ante-room) on rooms with frequent access.
- Permanent monitoring probes installed at the worst-case points the study finds, with alarms tested.
- Remapping triggers defined: layout changes, equipment changes, repeated excursions and a fixed review period.
Be There does not supply data loggers or mapping services, but we build the rooms that have to pass the study. Our walk-in cold rooms come as complete kits with PU or PIR insulation panels from 75 to 200 mm, insulated hinged or sliding doors, a matched condensing unit and evaporator sized for your ambient temperature, and a digital controller, for chilled rooms at 0 to +10 °C, freezers at −18 to −25 °C and pharmaceutical stores at 2–8 °C. Send your room size, temperature range, product and site conditions through the inquiry form and our engineers will propose a layout and refrigeration selection and quote FOB, CIF or DDP.